Remote sensor module of type VEL-R-5
Basic settings
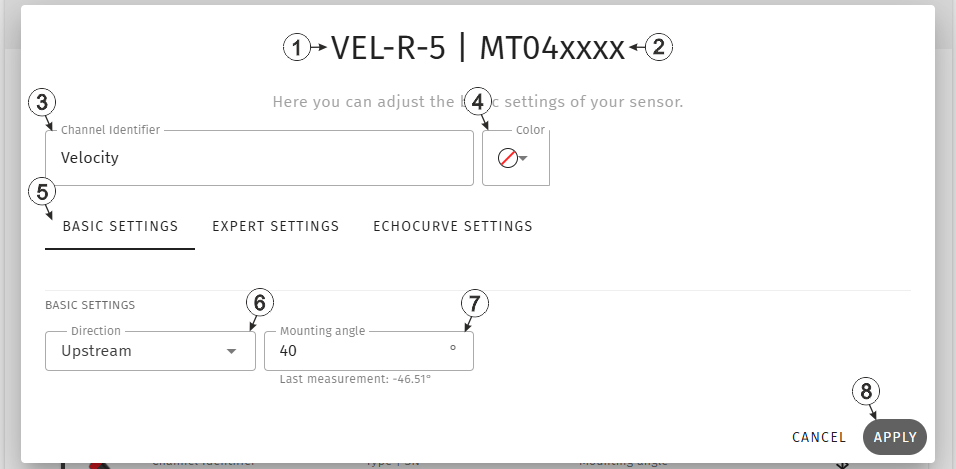
Input window "Remote sensor module of type VEL‑R‑5 ", tab "Basic settings"
| 1 | Type of the sensor
module used for determining the measurement value
VEL‑R‑5 (400416): Module for determining the surface velocity of fresh, dirty and gray water in water shafts and sewers using a radar sensor. |
|
| 2 | Serial number of the sensor module used for determining the measurement value | |
| 3 | Freely selectable, variable part of the designation for the measurement values
recorded via the sensor module assigned to the measuring channel
Several measurement values are recorded for each of the remote measurement channels. Their name is made up of the variable part and a fixed part which depends on the type of sensor module it is assigned to (e.g. "myName - Level", "myName - Distance", etc. for sensor modules of the type "Radar"). |
|
| 4 | Selection of the colour of the colour cap used
The selected colour is also The selected colour is also displayed in the "Measurement System" configuration section via the icon photo in the sensor module status information area. The colour caps make it easier to distinguish sensor modules of the same type when several are used |
|
| 5 | Buttons for switching between the individual tabs of the input window | |
| 6 | Selection of how the sensor module is aligned relative to the flow | |
| Upstream | The sensor points against the direction of flow. (recommended) | |
| Downstream | The sensor points in the direction of flow. | |
| 7 | Input field for the mounting angle (i.e. angle of
inclination between water surface and sensor)
The angle of inclination determined by the sensor module itself is displayed below the input field. For verification purposes, it can be compared to the entered mounting angle, whereby the negative sign should be ignored. The mounting angle entered in the field is used to calculate the actual surface velocity. (see Taking the mounting angle into consideration). |
|
| 8 | Button to apply the settings
Note: To save the settings, the "Save" button below the "Smart Actions" configuration
section must also be clicked.
|
|
Expert settings
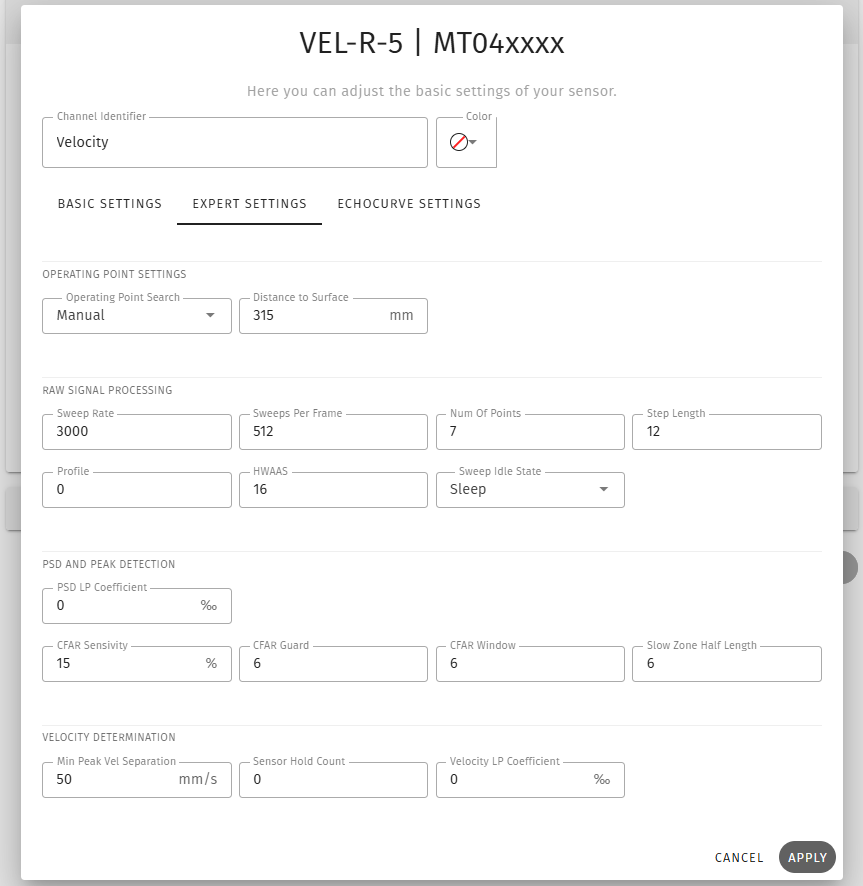
Input window "Remote sensor module of type VEL‑R‑5 ", tab "Expert settings"
Echocurve settings
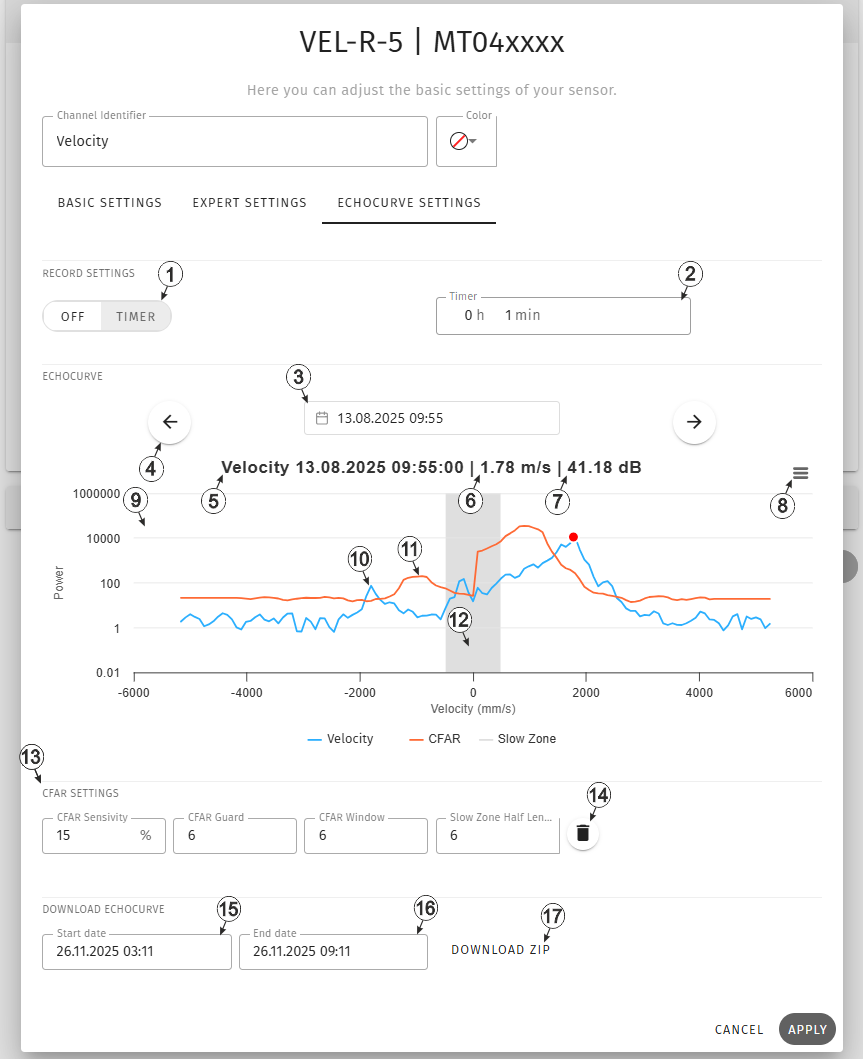
Input window "Remote sensor module of type VEL‑R‑5 ", tab "Echocurve settings"
| 1 | Mode for recording the echo curve | |
| Off | Echo curve recording deactivated | |
| Timer | Echo curves are recorded in the interval selected under "Timer" | |
| 2 | Interval in which the echo curves should be recorded (only visible if the modes "Timer" or "Timer + Event" have been selected)(can only be edited if "Timer" mode was selected) | |
| 3 | Selection of the day the echo curve should be displayed for.
When making your selection, the echo curves for the two days before and after the selected date are also loaded. You can then use the arrow icons to switch between the loaded echo curves. The echo curve created closest to the time selected using the date selection control (click on the calendar icon next to the date) is displayed first. In the date selection control, the days for which echo curves have been loaded are highlighted in blue, with the selected day marked in a darker shade of blue. |
|
| 4 | Switches to the privious/next echo curve
Once you have reached the end of the period for which the echo curves were loaded in advance, a new period must be selected using the date selection. |
|
| 5 | Designation of the selected measurement channel and time at which the echo curve was recorded | |
| 6 | Determined surface
velocity It is also shown in the echo curve display area by the red dot on the echo curve. |
|
| 7 | Signal-to-noise ratio
(SNR) SNR is a quality indicator for the velocity measurement value. |
|
| 8 | Opens a context menu in which full-screen mode can be activated for instance. | |
| 9 | Area for displaying the echo curve and the CFAR filter curve | |
| 10 | Echo curve (light blue measurement curve) | |
| 11 | CFAR filter curve (orange measuring curve) | |
| 12 | Slow zone, i.e. the area around zero, in which the measurement is of poor reliability | |
| 13 | Area for entering the
parameters for the CFAR filter and the slow zone The parameters entered here only affect the CFAR filter curve displayed in the echo curve display area and the slow zone. This allows the CFAR filter curve resulting from the application of the filter parameters to the respective echo curve to be visualised. The graphical representation makes it easier to select the appropriate CFAR filter parameters. To adjust the CFAR filter and slow zone stored in the VEL‑R‑5 , the corresponding parameters must be changed in the "Expert settings" tab. |
|
| 14 | Resets the parameters for the CFAR filter curve and slow zone displayed in the echo curve display area to the values saved in the "Expert settings" tab. | |
| 15 | Time from which the echo curves are required. | |
| 16 | Time until which the echo curves are required. | |
| 17 | Downloads the echo curve created during the specified period (i.e. between the start and end dates) as a zip file. The zip file contains a separate *.tsv file for each of the echo curves created during the specified period. By default, the start and end dates are set so that the echo curves from the last 6 hours are downloaded. | |
The "Echo curve" tab is used to select the interval at which the echo curve is to be recorded, to display the recorded echo curves and to visualise the CFAR filter curves..


