Remote sensor module of type Radar
Basic settings
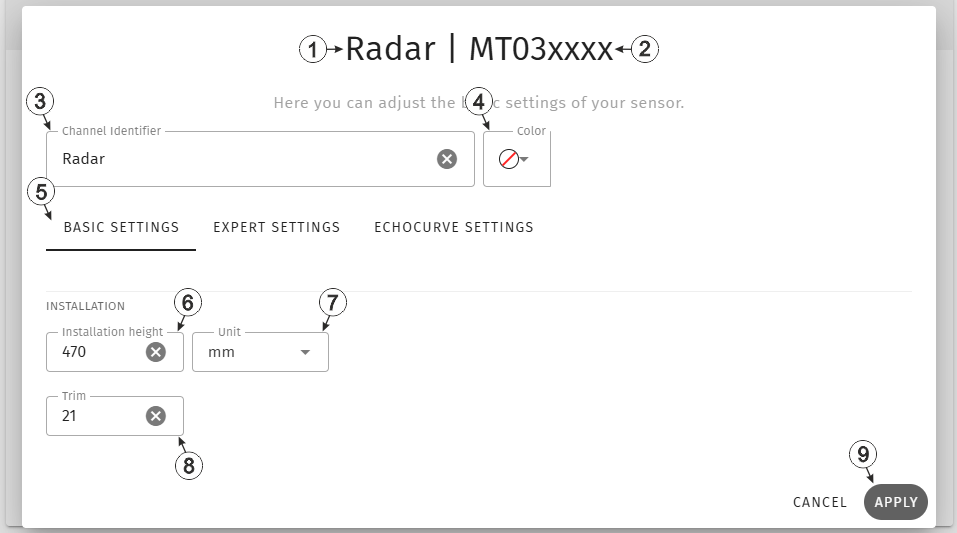
Input window "Remote sensor module of type Radar", tab "Basic settings"
| 1 | Type of the sensor
module used for determining the measurement value
Radar (301443): module for determining water levels of fresh, dirty and gray water via distance measurement using a radar sensor. |
|
| 2 | Serial number of the sensor module used for determining the measurement value | |
| 3 | Freely selectable, variable part of the designation for the measurement values
recorded via the sensor module assigned to the measuring channel
Several measurement values are recorded for each of the remote measurement channels. Their name is made up of the variable part and a fixed part which depends on the type of sensor module it is assigned to (e.g. "myName - Level", "myName - Distance", etc. for sensor modules of the type "Radar"). |
|
| 4 | Selection of the colour of the colour cap used
The selected colour is also The selected colour is also displayed in the "Measurement System" configuration section via the icon photo in the sensor module status information area. The colour caps make it easier to distinguish sensor modules of the same type when several are used |
|
| 5 | Buttons for switching between the individual tabs of the input window | |
| 6 | Specifies the installation height of the sensor.
Tip: Additional explanations on calculating the water level taking the
installation height into account can be found in the user manual of the sensor
module.
|
|
| 7 | Selection of the length unit (mm, cm or m) used by all of the server display elements | |
| 8 | Is
used to adjust the zero point
Tip: Additional explanations on the zero point adjustment (i.e. taking
triming into account) can be found in the user manual of the sensor
module.
|
|
| 9 | Button to apply the settings
Note: To save the settings, the "Save" button below the "Smart Actions" configuration
section must also be clicked.
|
|
Expert settings
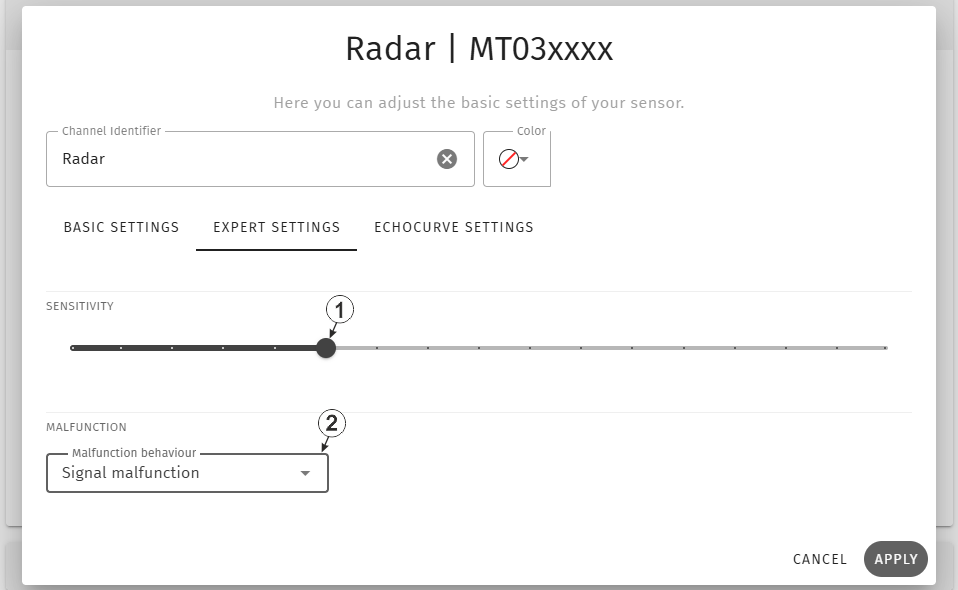
Input window "Remote sensor module of type Radar", tab "Expert settings"
| 1 | Selection of the
sensitivity of the signal recognition (CFAR sensitivity) Sensitivity is increased by moving the slider to the right. For larger distances or poorly reflective surfaces (empty overflow basin covered with mud), this can improve the reliability of the measurement. For short distances or highly reflective surfaces, however, reducing the sensitivity may improve the reliability of the measurement. |
|
| 2 | Selection of the value the radar sensor should supply in case the level couldn't be determined. | |
| Signal malfunction | The malfunction is signalled as "UF" (Underflow) | |
| Hold last measurement value | The measurement value is held until a valid value for the level can be determined again. | |
| Set level to 0 | The level is set to 0 | |
Echocurve
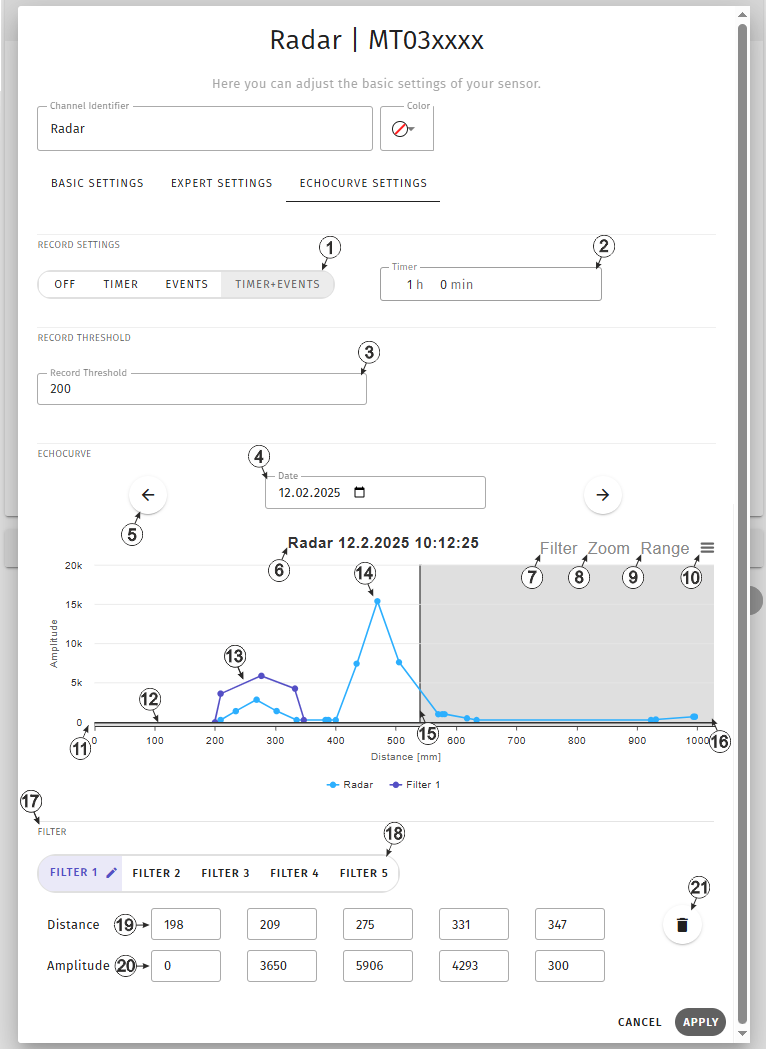
Input window "Remote sensor module of type Radar", tab "Echocurve"
| 1 | Mode for recording the echo curve | |
| Off | Echo curve recording deactivated | |
| Timer | Echo curves are recorded in the interval selected under "Timer" | |
| Events | Echo curves are recorded if a work point has been
lost. Possible causes for loosing the work point::
|
|
| Timer + Events | Echo curves are being recorded in the intervall selected under "Timer" if a work point has been lost | |
| 2 | Interval in which the echo curves should be recorded (only visible if the modes "Timer" or "Timer + Event" have been selected) | |
| 3 | Only amplitude values
that exceed this threshold are included in the echo curves. The threshold value is displayed as a black horizontal line in the echo curve display area. |
|
| 4 | Selection of the day the echo curve should be displayed for.
Days on which no echo curves have been created are greyed out in the control element for date selection (click on the calendar symbol next to the date). If no echo curve has been recorded for a manually selected day, the echo curve at the time closest to the selected time will be displayed. |
|
| 5 | Switches to the privious/next echo curve | |
| 6 | Designation of the selected measurement channel and time at which the echo curve was recorded | |
| 7 | Activates the mode for
automated creation of filter curves. By clicking and holding the mouse button, a section can be selected within which an automated filter curve will be created. The next available filter will be used for that. If all 5 filters are already used, no action is carried out. When creating the filter curve, the 5 reference points are first distributed symmetrically on the x-axis (distance). The amplitude (y-axis) of the 5 reference points is set to the value that corresponds to the echo curve at the x-position of the respective reference point. The reference points can be adjusted further by clicking and moving them in the graphic or by entering the distance and amplitude values in the area for manual input of the reference points.. |
|
| 8 | Activates the zoom
function. By clicking and holding the mouse button, you can select an area to be enlarged. The zoom can be cancelled using the "Reset zoom" button displayed under the "Magnifying glass" symbol. |
|
| 9 | Expands the displayed
area of the echo curve to the complete range of the distance-axis (0-5000 mm) The area displayed by default depends on the configured mounting height. Parts of the echo curve (underneath the configured mounting height) may not be displayed. |
|
| 10 | Opens a context menu in which full-screen mode can be activated for instance. | |
| 11 | Area for displaying the echo curves and the filters set for the interference signal suppression | |
| 12 | Recording
threshold Only amplitude values above this threshold are included in the echo curves. |
|
| 13 | Filter curve The 5 reference points can be adjusted by clicking and holding the mouse button, provided the zoom function or the mode for the automated creation of filter curves are deactivated. |
|
| 14 | Echo curve (light blue measurement curve) | |
| 15 | Distance at which the ground should be located (according to configured installation height) | |
| 16 | Area of the echo curve
which is located underneath the ground (according to configured installation
height). Parts of the echo curve displayed here are usually the result of multiple reflections and should be suppressed using the filter curve. |
|
| 17 | Area for manual input of the reference points | |
| 18 | Selection for which of
the 5 filters the input windows are displayed in the area for manual input of the
reference points. The selected filter is highlighted by changing the background colour. If the filter is not in use, the dot next to the name is grey. If the filter is in use, the colour of the dot corresponds to the colour of the filter curve in the graphic. A pencil symbol is also displayed next to the name. After clicking again on an already selected filter, the name of the filter can be changed. |
|
| 19 | Input fields for the distance value (x-axis) of the 5 reference points of the filter | |
| 20 | Input fields for the amplitude (y-axis) of the 5 reference points of the filter | |
| 21 | Deletes the filter | |
The "Echocurve" tab is used to select the conditions under which the echo curve should be recorded, to display the recorded echo curves and to configure the filters that can be used to suppress interference signals.
|
|
| How-To-Video: Suppressing interference signals |